Custom Shortcode Strategies for Visualizing Accuracy Trends in Forecasting Platforms
Written by Sofia Klein · Sep 3, 2026
Custom Shortcode Strategies for Visualizing Accuracy Trends in Forecasting Platforms
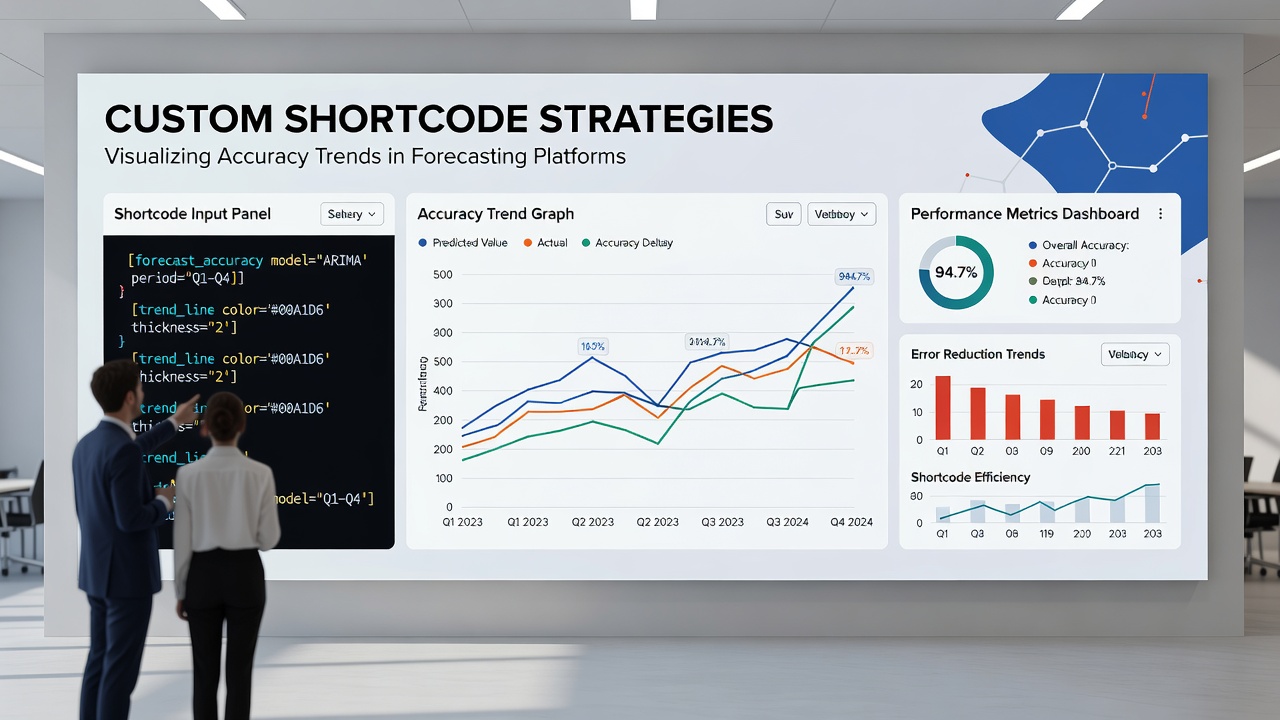
Forecasting platforms rely on custom shortcodes to pull performance data and render it as interactive visuals that highlight accuracy patterns over time, and developers implement these shortcodes through functions that query databases while calculating metrics such as mean absolute error or hit rates before passing results to charting libraries. These approaches allow sites to display line graphs showing accuracy fluctuations across weeks or months without requiring manual updates each time new predictions arrive.
Core Components of Shortcode-Based Visualization Systems
Shortcodes function as placeholders that WordPress processes into dynamic content, and when applied to forecasting tools they typically connect to custom post types or tables storing historical predictions alongside actual outcomes. Data retrieval happens through SQL queries optimized for date ranges, after which accuracy percentages are computed using formulas that compare forecasted values against verified results, and the output feeds into JavaScript functions that generate charts using libraries like Chart.js or D3.js.
One approach involves parameters passed directly in teh shortcode itself, such as [accuracy_trend period="90days" metric="strike_rate"], which filters records and adjusts the visualization accordingly. This setup supports multiple chart types including area fills for cumulative accuracy and scatter plots for individual prediction deviations, while conditional logic ensures that only complete data sets appear to avoid misleading gaps in the trend lines.
Implementation Techniques for Trend Accuracy Displays
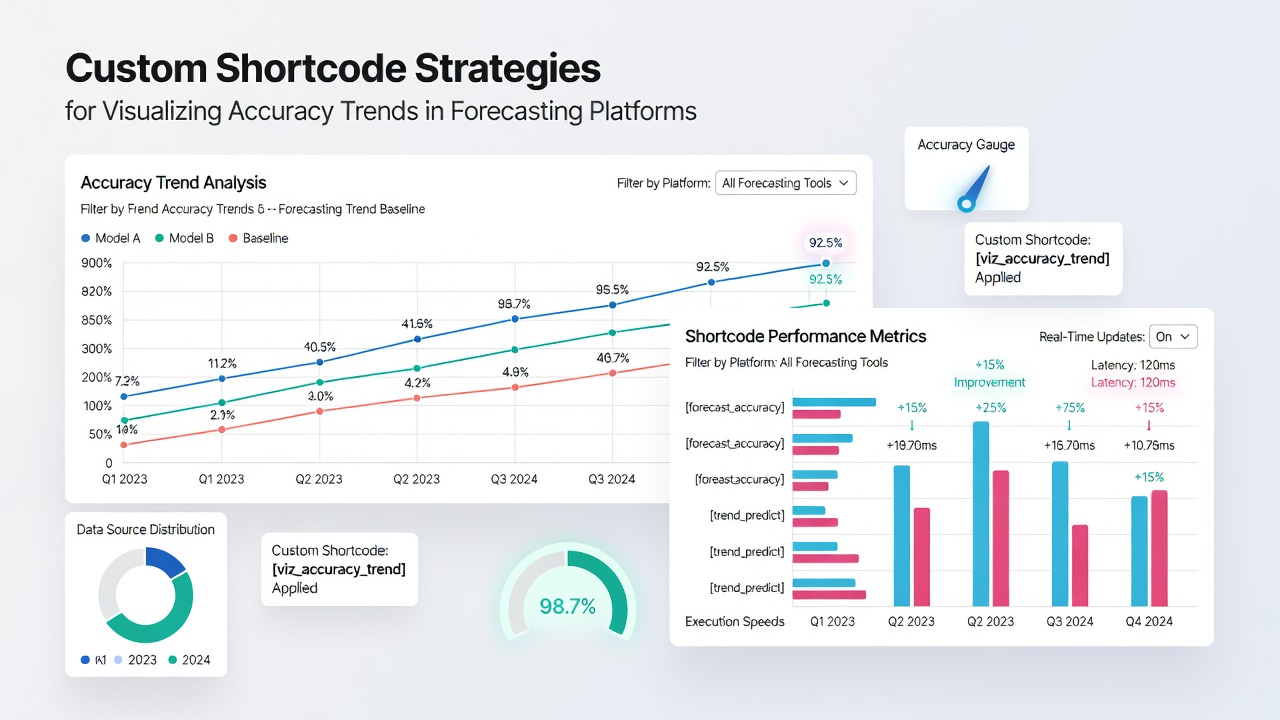
Developers often register shortcodes in theme files or dedicated plugins, where the handler function sanitizes inputs and validates user permissions before executing database calls. Caching mechanisms store rendered chart data for set intervals to reduce server load during high-traffic periods, and real-time updates trigger through AJAX calls that refresh only the affected visual elements when new outcome data enters the system.
Integration with existing user roles lets tipster or analyst accounts view personalized accuracy trends, while public views display aggregated platform-wide figures. Color coding applied through CSS classes indicates performance thresholds, with green shades for improving accuracy streaks and red for declining periods, and tooltips reveal exact calculation details on hover without cluttering the main display area.
Data Handling and Metric Calculation Practices
Accuracy trends require consistent data pipelines that log every forecast at the moment of creation and pair it with verified results once events conclude. Shortcode scripts handle edge cases such as postponed matches or missing outcomes by excluding incomplete entries from percentage calculations, and rolling averages smooth daily volatility to reveal longer-term patterns. According to research from the National Institute of Standards and Technology, standardized error metrics improve comparability across different forecasting models when applied uniformly.
Export options built into the shortcode output allow users to download underlying datasets as CSV files, and this feature supports further analysis in external tools. Multi-site installations share shortcode definitions across networked platforms, ensuring uniform visualization standards while permitting site-specific styling overrides through theme filters.
Advanced Strategies Introduced Around September 2026
Platform updates released in September 2026 expanded shortcode capabilities to include predictive overlays that project future accuracy based on historical slopes, and these additions rely on lightweight regression calculations executed server-side before chart rendering. Integration with external APIs from organizations such as the Organisation for Economic Co-operation and Development supplies benchmark data that contextualizes internal accuracy trends against broader industry performance indicators.
Responsive design adjustments ensure charts adapt to mobile screens by reducing data points and simplifying axis labels, while maintaining full interactivity on larger displays. Security practices restrict direct database access within shortcode handlers and instead route all queries through prepared statements that prevent injection risks.
Conclusion
Custom shortcode methods continue to evolve as forecasting platforms seek clearer ways to present accuracy information, and the combination of parameterized queries, cached outputs, and interactive charting libraries provides flexible solutions that scale with growing data volumes. These strategies support both individual analyst tracking and platform-level oversight through consistent visual formats that update automatically as new results become available.